In this section, you'll find a selection of my projects. The code for the Market Project is available on GitHub.
Besides these, I can share any of my other code without issues.
I started coding in Python 6 years ago, and I have completed a few projects (in engineering school and university) in C. This year, we will be doing a 5-week C++ project.
I also took SQL classes, so I have the basics.
For the IDE, I mostly use PyCharm, Spyder and VSCode.
The Market Project
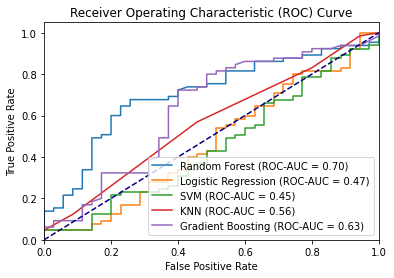
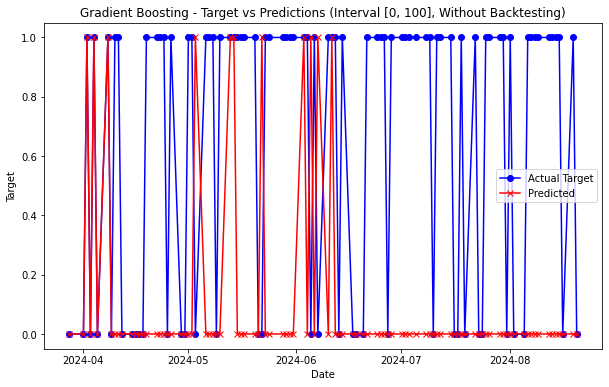
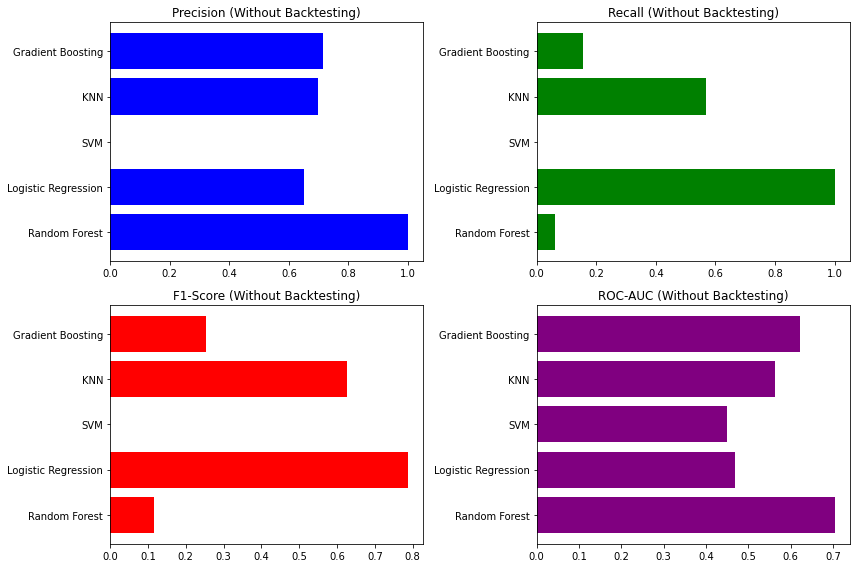
I developed a market analysis project using machine learning to predict stock price movements. I implemented various models including Random Forest, Logistic Regression, SVM, KNN, Gradient Boosting. I incorporated backtesting and feature engineering techniques. This project showcases some skills in data processing, API integration, web scraping and model evaluation, while highlighting the complexities and limitations of financial forecasting.
Here is a link to the GitHub repository: Market Project
The Bicycle Project : Nantes
This project is more about analyzing data from a .json file, available here. (I'm also writting a GitHub repository for this one. It will come later. I will be as precise as possible here)
To summarize this project, I separated it in 3 steps :
I will be a bit concise here because a lot of conclusions can be made from this dataset.
There are many ways to quantify traffic in a station.
As a first approach, I considered the variance of available bikes divided its total capacity. I added some criterias I judged "natural".
In additon, I used some TSFresh criterias in order to have a (almost) complete caracterisation of the stations.
The main difficulty I had was to normalise (i.e. no unity) and
scale values in order to compare them.
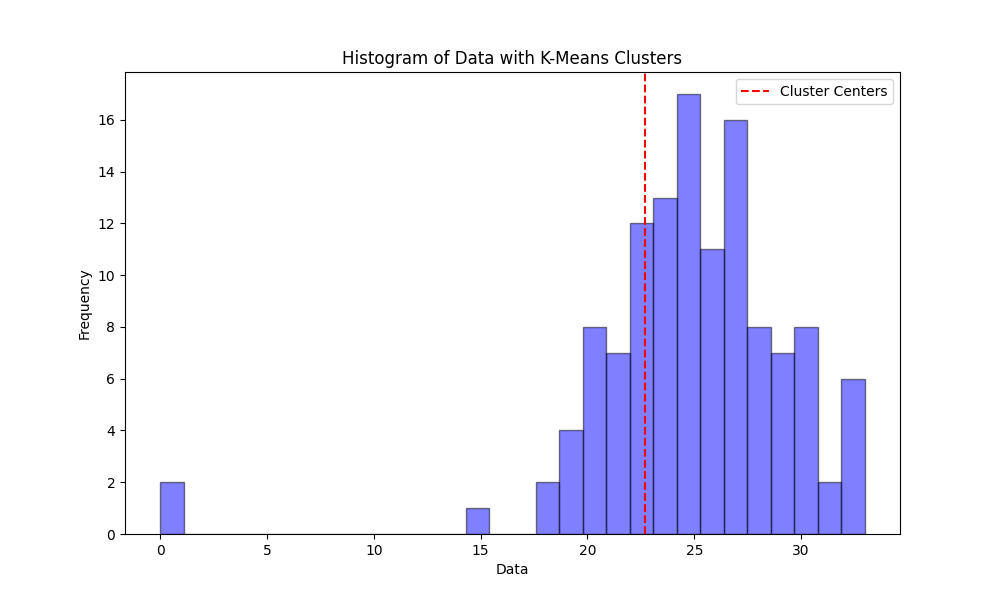
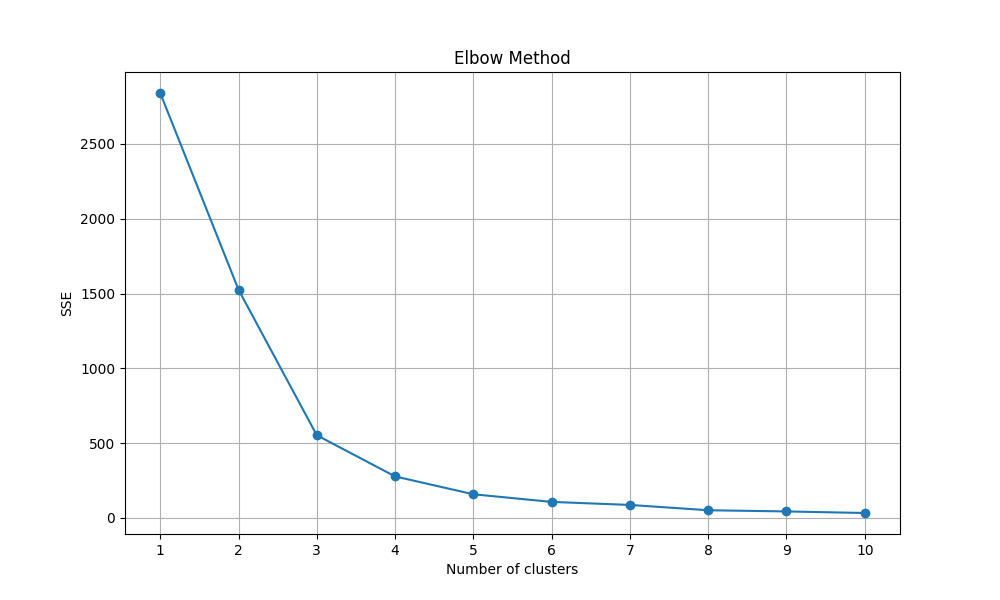
Then, with methods such as the elbow method, we determine how many clusters we will consider. After, I applied the K-mean clustering algorithm.
Quick conclusion : More details on GitHub.
The trivial conclusion is to augment the maximum number of bikes in those frequented stations.
A finer analysis would consist in optimising the capacities of stations in order to minimize the time a station is empty or full,
while having to invest the minimum in buying new bikes. We can also think about a better repartition of bikes within the city to optimise traffic.
Bachelor Mémoire
For my Bachelor's degree, I had to write a mémoire on a subject of my choice, as long as it involved math or computer science.
I chosed to work on the Continuum Hypothesis and Dana Scott's proof of it.
First, he reformulated the hypothesis using logical symbols within a specific language.
Then, he constructed a mathematical model where the definition of truth is revised, and in which the hypothesis does not hold true—demonstrating its independence.
The proof is long and technical. The fields involved are Logic and Set Theory.
Here is my paper; it is in French:
Mémoire.

Project: Summarizing a Text; Graphs, PageRank, TF-IDF... (a GitHub repository is coming for this project as well)
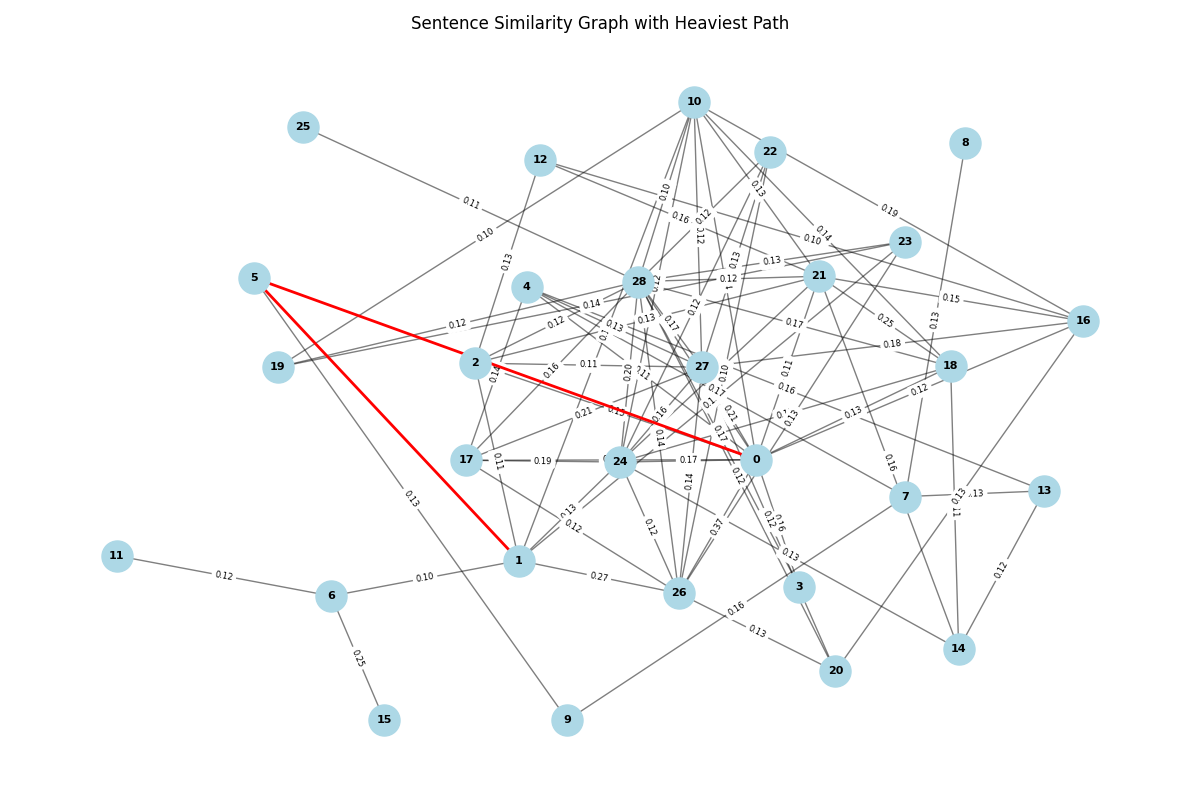
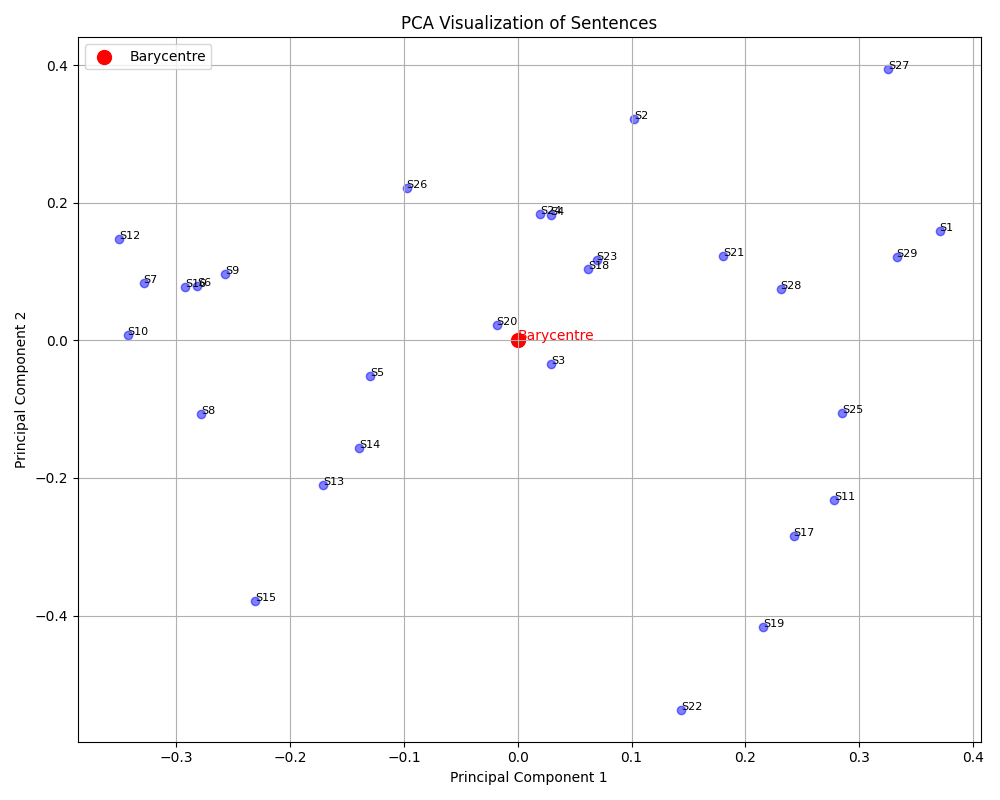
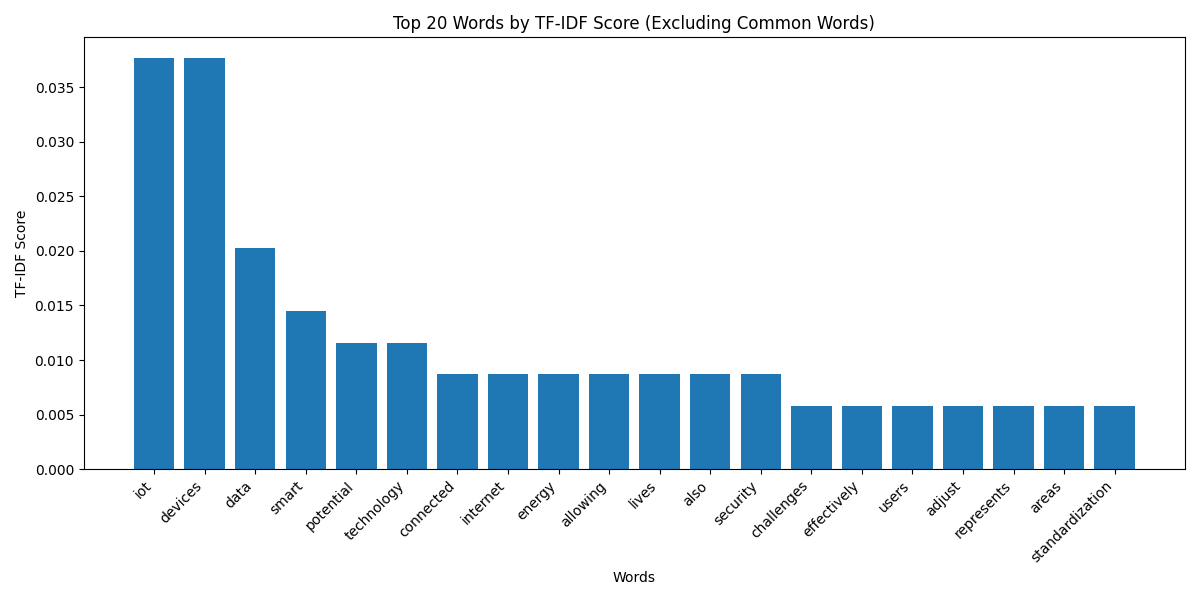
This project processes a document and extracts key sentences using graph-based algorithms. These techniques utilize graph structures to analyze relationships between elements. The document is split into sentences, which are vectorized using TF-IDF to calculate their importance. A cosine similarity matrix is built, creating a graph where each sentence is a node, and edges are weighted by sentence similarity.
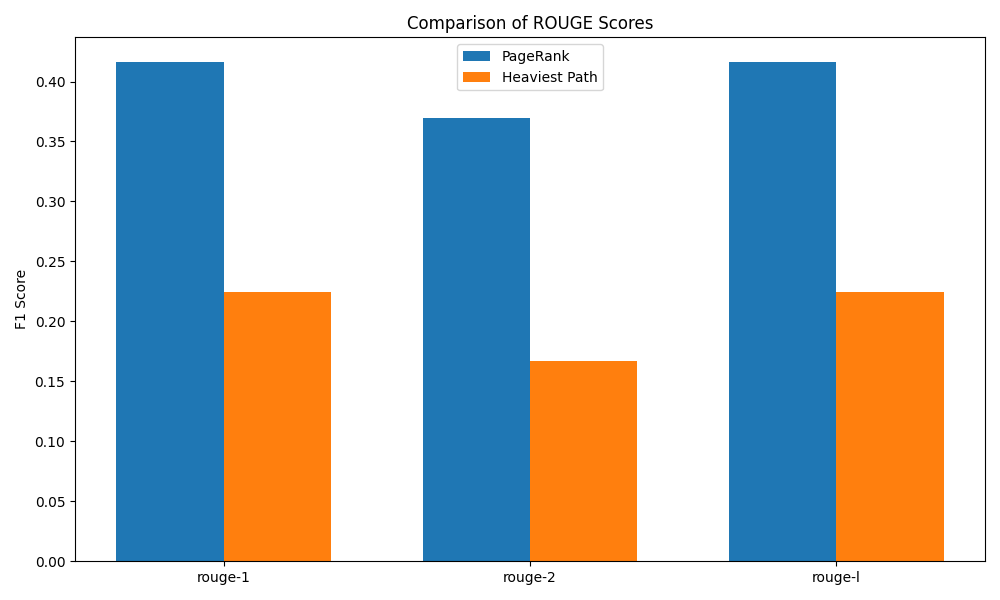
Two algorithms are used for summarization:
The summaries are evaluated using ROUGE scores to compare their quality. Additionally, visualizations such as TF-IDF plots, similarity graphs, and PCA help illustrate sentence importance and structure.
This project can be separated into 3 steps:
Quick conclusion: More details on GitHub. Text used here.
There are advantages to using these methods. For example, the graph summary will give us - by construction - only relevant sentences.
However, it may miss some important information that is isolated in the document.
Moreover, the PageRank-based summarization works really well with clear and stated themes.
Nevertheless, it may not capture the narrative flow and can sometimes be redundant.
I can also add that this kind of summary is extractive, in the sense that we do not create a summary; we simply pick sentences.
A more advanced solution would be to generate one from both high-scored sentences and words.
Diffusion, Gradient, Laplacian, PDEs and Other Calculations
Throughout my education and various school or personal projects, I've implemented many mathematical operations and computations to solve problems. Whether it's computing Laplacians, solving differential equations in vector spaces, finding the minimum of multivariable functions, or interpolating functions with polynomials, I have gained a basic but necessary experience.
This Website
I learned the basics of HTML, CSS, and JavaScript to create this personal portfolio website, designed to show my projects and skills. This project demonstrates my ability to learn new technologies and competences, apply problem-solving skills, and effectively present my work. This site serves as a dynamic resume, highlighting my different projects in data science, mathematics, and computer science while reflecting my commitment to continuous learning and self-improvement.
Below are two interactive graphs that represent classic methods in data science. I'm using a web app hosted on Pythonanywhere to display a Python script on this web page.
I offer private lessons in mathematics, computer science, and physics-chemistry from middle school to first-year university level. My lessons will be tailored to your needs, whether you are in middle school, high school, or university.
More information on my profile SuperProf
To book a lesson, feel free to go through the Contact section.

I have always been passionate about science, particularly mathematics and computer science. For the past three years, I have had the pleasure of giving private lessons in mathematics, physics-chemistry, and computer science, with the goal of making these subjects accessible and exciting by tailoring my lessons to the needs and goals of each student.
Outside of these lessons and my studies, I practice gliding and archery. These activities allow me to learn patience, precision, and the rigor that these sports require.
I remain very curious and motivated in everything I undertake, so don't hesitate to come and chat!
You can view my resume here: Resume
At Lycée Louis Lachenal in Argonay.
MPSI then MP* at Lycée Berthollet in Annecy.
Phelma in Grenoble. A school focused on physics, materials, and electronics.
ENSIMAG in Grenoble. Another engineering school focused on mathematics and computer science.
Do you have a question, a project, or want to learn more? Feel free to contact me. I am always available to discuss new ideas, answer your questions, or collaborate on projects.
Fill out the form below to send me a message directly. I will get back to you as soon as possible.